Statistical initiation for RAMS
In the RAMS field, everything quantified is inherently linked to probability and statistics. Here is a short explanation around one of the RAMS Basics: the notion of “bathtube curve”.
How is a failure quantified?
The rating of a risk in preliminary design
A failure is quantified by its probability within a specific timeframe. The lifecycle of a system unfolds in three phases:
Youth period: In the early stages, the system is prone to failures due to tuning or quality issues during the V cycle. These issues are rectified through trials, handled either during product acquisition via validation tests (common for large-scale production with burn-in processes) or during the operational phase for tailored products, managed within the warranty period.
Useful lifetime: Failures encountered during the youth period are corrected, resulting in low and stable occurrences.
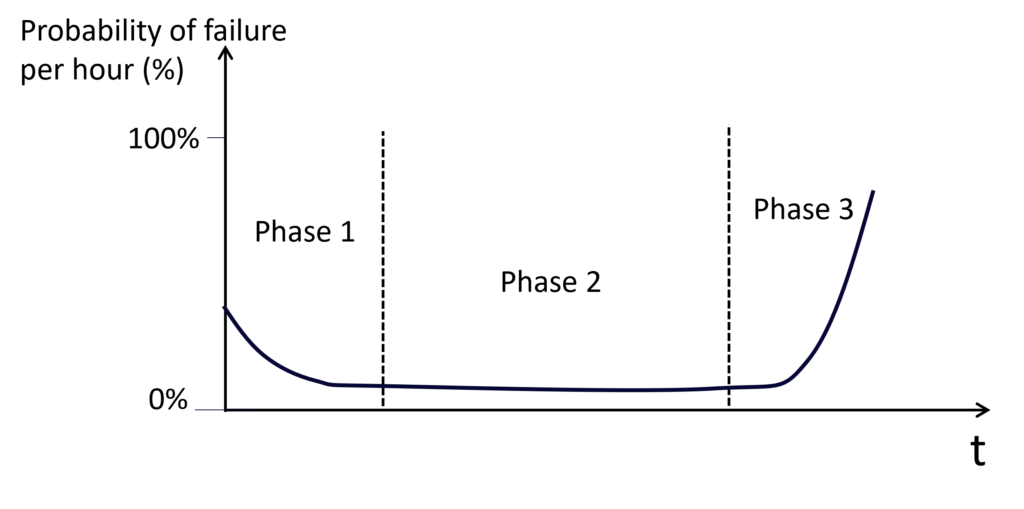
Wear period: With prolonged use, the system weakens, becoming more susceptible to failures. These phases are visualized through the ‘bathtub curve,’ indicating a high likelihood of failure during the youth period, decreasing over time to a stable minimum in the useful lifetime, then suddenly increasing as the wear period begins.
These phases are illustrated by the so-called “bathtub curve” due to its distinctive shape. During the youth period, the likelihood of failure is high and gradually decreases over time, reaching a stable minimum marking the beginning of the useful lifetime. Subsequently, at a certain point, the likelihood undergoes a sudden increase, signifying the entry into the wear period.
Here is another interpretation of what happens, when a large quantity of systems is tested simultaneously.
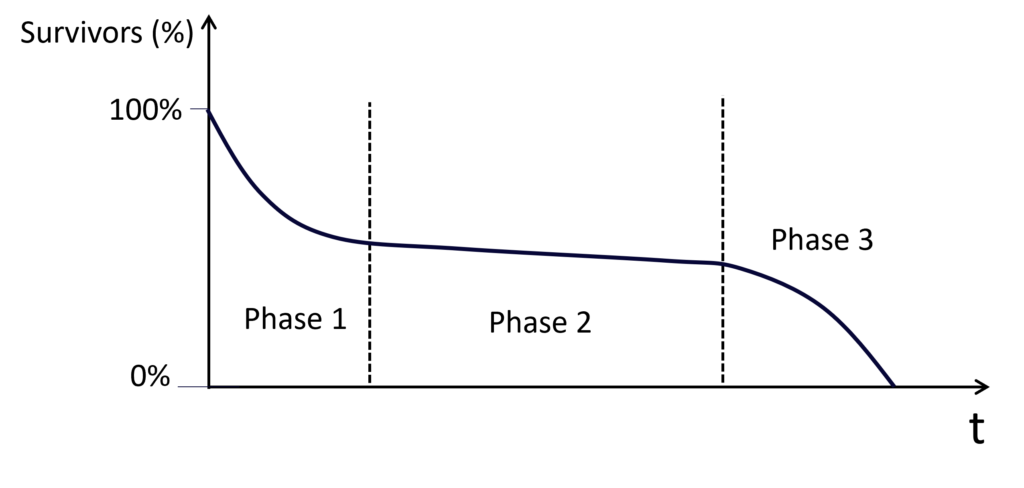
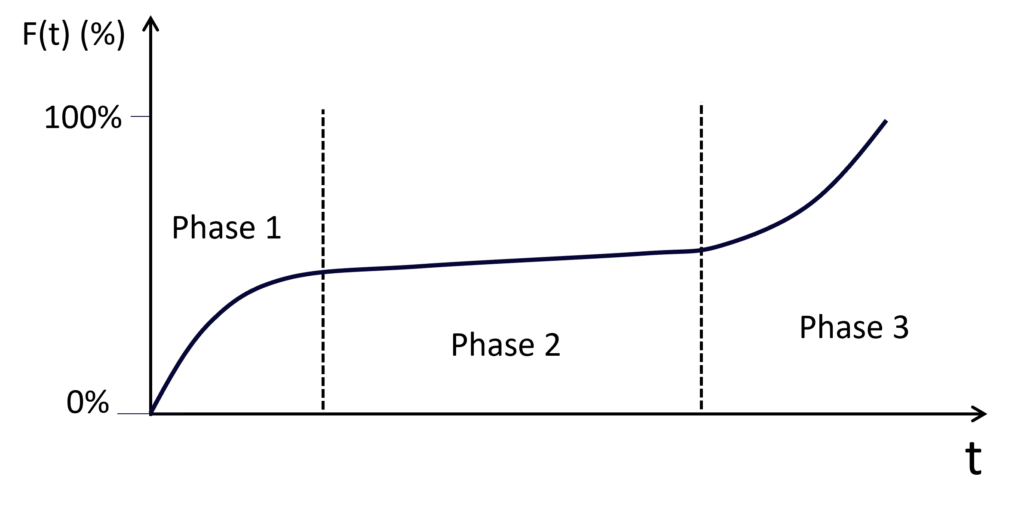
The ratio of “survivors” is formally known as the “cumulative distribution function of the reliability function” denoted as R(t). The complementary function to R(t) is the cumulative distribution function for the failure function, noted as F(t). It quantifies the proportion of failed systems over time, expressed as R(t) = 1 – F(t).
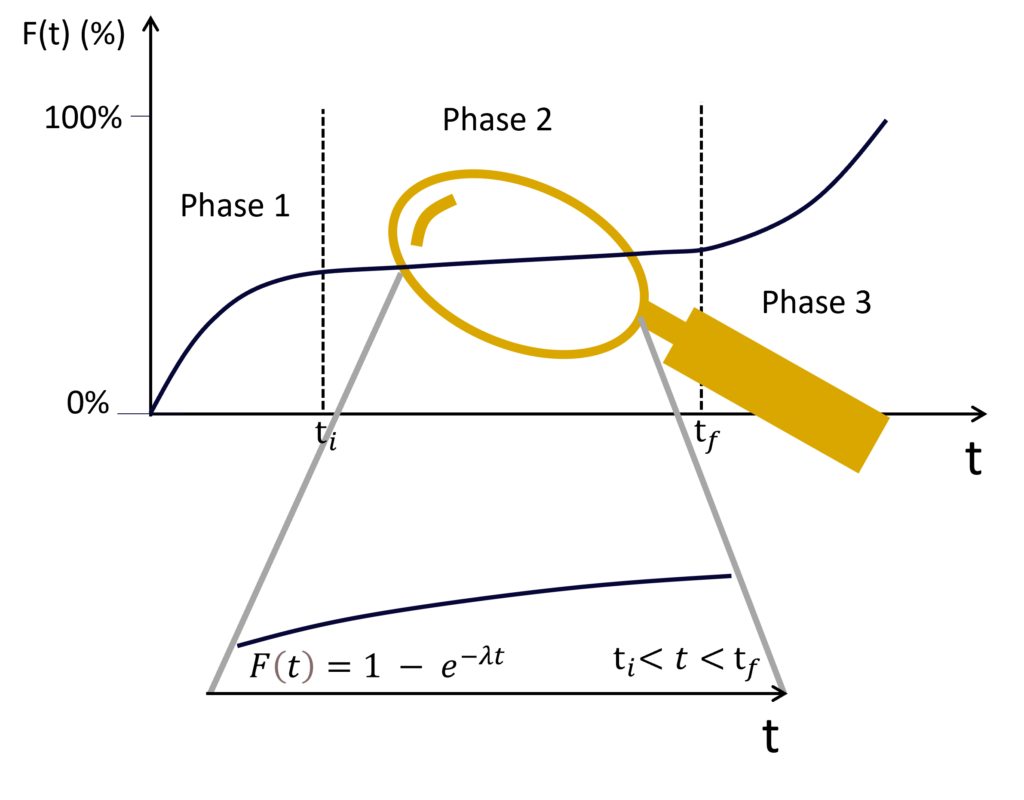
In the RAMS field, calculations revolve around the useful lifetime, facilitated by enforced burn-in procedures and specified, statistically derived lifetime values. It is assumed that a mature product maintains a constant failure probability per hour throughout its specified lifetime.
Two closely related notions quantifying failure likelihood in the RAMS field are the key references for quantitative objectives:
Probability of failure (characterized with F(t)): The likelihood of failure over time.
Failure rate (λ): Represents the number of failures in a given time.
The probability is a function of time and the failure rate. For electronic systems and generally in most cases, the probability of failure follows the exponential degradation law (primarily during phase two) and is expressed as F(t) = 1 – e^(-λt).
Note: It’s worth mentioning that other system types, such as mechanical systems, may adhere to slightly different failure functions. However, these nuances will be explored in greater detail in the subsequent reliability section.